
| 일 | 월 | 화 | 수 | 목 | 금 | 토 |
|---|---|---|---|---|---|---|
| 1 | 2 | 3 | 4 | 5 | 6 | 7 |
| 8 | 9 | 10 | 11 | 12 | 13 | 14 |
| 15 | 16 | 17 | 18 | 19 | 20 | 21 |
| 22 | 23 | 24 | 25 | 26 | 27 | 28 |
- prometheus
- POD
- Python
- 외부 모듈
- aews ci/cd
- grafana
- Jenkins
- 도커
- eks endpoint access
- AWS
- 클라우드 국비지원교육
- keda
- storageclass
- outposts local cluster
- 합격 후기
- 클라우드 엔지니어
- Terraform
- EKS
- karpenter
- aews
- kubernetes
- 클라우드 국비지원교육 후기
- aws outposts
- docker
- aews vault
- 국비지원교육
- 단기 합격
- VPA
- observability
- k8s
- Today
- Total
모험가
EKS on Outposts Observability(OTEL, Prometheus, Tempo, Loki, Grafana) 본문
EKS on Outposts Observability(OTEL, Prometheus, Tempo, Loki, Grafana)
라리음 2025. 5. 29. 09:46
* 잘못된 정보들은 계속해서 수정할 예정이니 말씀 부탁드리겠습니다.
OpenTelemtry란?
**OTEL(OpenTelemetry)**은 애플리케이션의 **관측성(Observability)**을 위한 오픈소스 프레임워크로,
분산 추적(Tracing), 메트릭(Metrics), 로그(Logs)를 통합적으로 수집하고 전송할 수 있게 해줍니다.
현재 OTEL은 **CNCF(Cloud Native Computing Foundation)**에서 주도하고 있는 공식 프로젝트로, Prometheus, Kubernetes와 같은 다른 CNCF 프로젝트들과 함께 클라우드 네이티브 생태계의 핵심 도구 중 하나로 자리잡고 있습니다.
Observability는 이전글에 상세히 작성하였습니다.
AEWS 4주차 - Observability(Monitoring, EKS 컨트롤 플레인, 파드 로깅)
본 글은 가시다님이 진행하시는 AEWS(AWS EKS Workshop Study)를 참여하여 정리한 글입니다. 모르는 부분이 많아서 틀린 내용이 있다면 말씀 부탁드리겠습니다! Observability와 Monitoring 구분옵저빌리티모
rhims.tistory.com
기능
|
저는 그중 OpenTelemetry, Prometheus, Tempo, Loki, Grafana를 이용해 통합 대시보드를 구성해보려합니다.
구성도
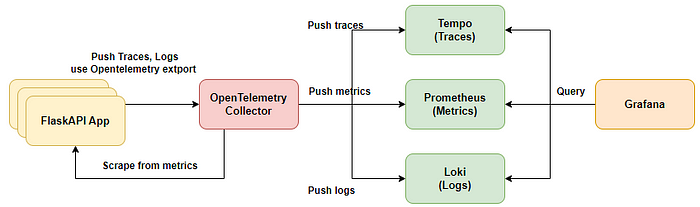
구성 설명
1. EKS위에서 구동하는 App에 대해서 OpenTelemetry Colletcor을 이용해서 Trace, Log, Metric들을 수집합니다.
2. Trace는 Grafana Tempo로 Push하여서 Grafana에 표출합니다.
3. Metrics은 Prometheus에 Push하여 Grafana에 표출합니다.
4. logs들도 Loki에 Push하여 Grafana에 표출합니다. - Loki는 AWS S3와 연동 예정
이렇게 Grafana에서 통합하여 운영자가 보다 효율적으로 모니터링이 가능하게끔 구성하려합니다.
저는 IRSA를 지원하지 않는 Cluster에서 구성하므로 IRSA가 가능하다면 이용하시면 됩니다.
왜 Promtail이 아닌 OTEL Collector를 사용하는가?
Loki 기반의 로그 수집을 구성할 때, 일반적으로는 Promtail을 많이 사용합니다. 하지만 저희는 Promtail 대신 OTEL(OpenTelemetry) Collector를 선택했습니다. 그 이유는 간단합니다:
관측성(Observability) 구성 요소가 늘어나면서 관리 포인트를 줄이고, 통합된 파이프라인을 운영하고 싶었기 때문입니다.
Promtail vs OTEL Collector – 무엇이 다른가?
| 항목 | Promtail | OTEL Collector |
| 주요 기능 | 로그 수집 전용 | 로그 + 메트릭 + 트레이스 통합 수집 |
| Loki 연동 | 기본 지원 | Exporter를 통해 지원 |
| 구성 방식 | 별도 구성 필요 | 통합 구성 가능 (하나의 Collector로 처리) |
| 확장성 | Loki에 최적화됨 | 다양한 백엔드로 자유롭게 Export 가능 |
| 운영 포인트 | 로그 전용 에이전트 관리 필요 | Collector 하나로 통합 운영 |
이제 순차적으로 설치하겠습니다.
* 모든 배포는 Helm을 이용하겠습니다.
구성은 AWS ALB아래에 경로 기반을 통해서 prometheus와 grafana의 웹에 접근합니다.
Prometheus
prometheus-values.yaml 생성
service:
  type: ClusterIP
  port: 9090

server:

  global:
    scrape_interval: 15s

  scrape_configs:
    - job_name: 'otel-collector'
      scrape_interval: 10s
      kubernetes_sd_configs:
        - role: pod
      relabel_configs:
        - source_labels: [__meta_kubernetes_pod_annotation_prometheus_io_scrape]
          action: keep
          regex: true
        - source_labels: [__meta_kubernetes_pod_annotation_prometheus_io_port]
          action: replace
          target_label: __address__
          regex: (.*)
          replacement: $1
        - source_labels: [__address__]
          action: replace
          regex: (.*):.*
          replacement: $1:8887 # telemetry 포트로 명시
        - source_labels: [__meta_kubernetes_namespace]
          action: keep
          regex: monitoring
기본적으로 prometheus는 push를 받지 않고 pull을 받습니다.
otel collector은 exporter을 통해 push하지만, prometheus는 push를 받지 못하기에
otel에서 telemetry port를 open해주면 prometheus에서 scrape하여서 확인합니다.
Helm repo 추가
helm repo add prometheus-community https://prometheus-community.github.io/helm-charts
Prometheus 배포
kubectl create ns monitoring
helm install prometheus prometheus-community/prometheus --namespace monitoring
확인
kubectl -n monitoring get all
Loki
AWS S3 버킷 생성

저는 IRSA를 사용하지 않으므로 Secret을 생성하여 이용합니다.
kubectl create namespace logging
kubectl create secret generic s3-creds \
  --namespace=logging \
  --from-literal=aws_access_key_id=<YOUR_ACCESS_KEY> \
  --from-literal=aws_secret_access_key=<YOUR_SECRET_KEY>
loki-values.yaml 생성
loki:
  server:
    http_listen_port: 3100
    grpc_server_max_recv_msg_size: 8938360
    grpc_server_max_send_msg_size: 8938360

  structuredConfig:
    auth_enabled: false

    compactor:
      apply_retention_interval: 1h
      compaction_interval: 10m
      retention_delete_delay: 2h
      retention_delete_worker_count: 150
      retention_enabled: true
      shared_store: s3
      working_directory: /var/loki/compactor

    limits_config:
      ingestion_rate_mb: 5
      ingestion_burst_size_mb: 10
      max_global_streams_per_user: 100000
      max_streams_per_user: 100000
      reject_old_samples: false
      retention_period: 30d
      per_stream_rate_limit: 3MB
      per_stream_rate_limit_burst: 10MB
      max_query_parallelism: 90

    ingester:
      max_transfer_retries: 0
      chunk_idle_period: 1h
      chunk_target_size: 1572864
      max_chunk_age: 2h
      chunk_encoding: snappy
      lifecycler:
        ring:
          kvstore:
            store: memberlist
          replication_factor: 3
        heartbeat_timeout: 10m
      wal:
        dir: /var/loki/wal
        replay_memory_ceiling: 800mb

    storage_config:
      aws:
        region: ap-northeast-2
        bucketnames: loki-bucket-0520
        s3forcepathstyle: true
        endpoint: https://s3.ap-northeast-2.amazonaws.com
        access_key_id: null
        secret_access_key: null
      tsdb_shipper:
        shared_store: s3
        active_index_directory: /var/loki/tsdb-index
        cache_location: /var/loki/tsdb-cache
      index_queries_cache_config:
        memcached:
          batch_size: 100
          parallelism: 100

    schema_config:
      configs:
        - from: 2020-10-24
          store: tsdb
          object_store: s3
          schema: v13
          index:
            prefix: index_
            period: 24h

    chunk_store_config:
      max_look_back_period: 48h
      chunk_cache_config:
        memcached:
          batch_size: 100
          parallelism: 100
      write_dedupe_cache_config:
        memcached:
          batch_size: 100
          parallelism: 100
    querier:
      max_concurrent: 16

    query_scheduler:
      max_outstanding_requests_per_tenant: 32768

extraEnv:
  - name: AWS_ACCESS_KEY_ID
    valueFrom:
      secretKeyRef:
        name: s3-creds
        key: aws_access_key_id
  - name: AWS_SECRET_ACCESS_KEY
    valueFrom:
      secretKeyRef:
        name: s3-creds
        key: aws_secret_access_key

serviceAccount:
  create: true
  name: "loki"
  automountServiceAccountToken: true
  # IRSA 제거

ingester:
  replicas: 3
  maxUnavailable: 1
  resources:
    requests:
      cpu: 100m
      memory: 256Mi
    limits:
      memory: 1Gi
  persistence:
    enabled: true
    claims:
      - name: data
        size: 10Gi
        storageClass: ebs-sc

distributor:
  resources:
    requests:
      cpu: 100m
      memory: 256Mi
    limits:
      memory: 256Mi

querier:
  resources:
    requests:
      cpu: 100m
      memory: 512Mi
    limits:
      memory: 512Mi

queryFrontend:
  resources:
    requests:
      cpu: 100m
      memory: 512Mi
    limits:
      memory: 512Mi

gateway:
  resources:
    requests:
      cpu: 100m
      memory: 512Mi
    limits:
      memory: 512Mi

compactor:
  enabled: true
  serviceAccount:
    create: true
원하는 schema로 정해줘야하며, 버킷명을 유의해줍니다.
Helm repo 추가
helm repo add grafana https://grafana.github.io/helm-charts
helm repo update
Loki 배포
helm upgrade --install loki grafana/loki-distributed \
  --namespace=logging \
  --values loki-values.yaml
확인
kubectl -n logging get all
Tempo
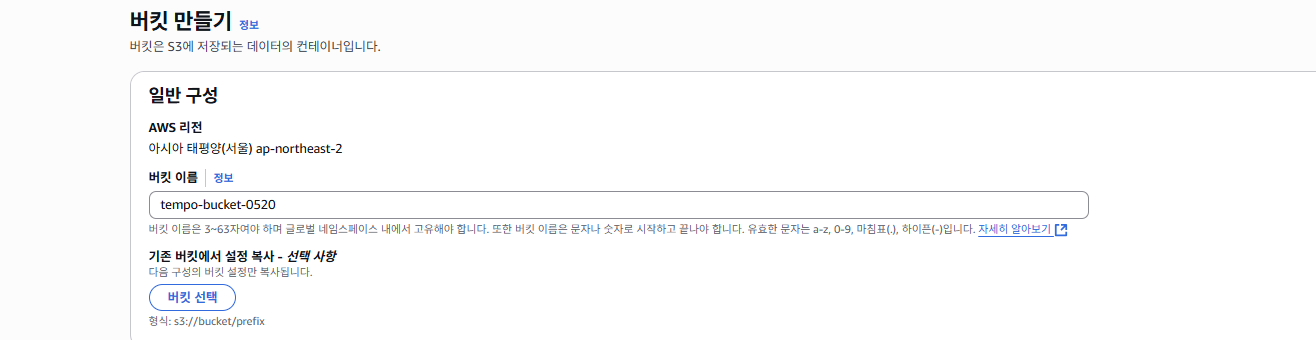
AWS S3 버킷 생성
secret 생성
kubectl create namespace monitoring
kubectl create secret generic s3-creds \
  --namespace=monitoring \
  --from-literal=aws_access_key_id=<YOUR_ACCESS_KEY> \
  --from-literal=aws_secret_access_key=<YOUR_SECRET_KEY>
tempo-values.yaml 생성
tempo:
  storage:
    trace:
      backend: s3
      s3:
        bucket: tempo-bucket-0520
        endpoint: s3.ap-northeast-2.amazonaws.com
        region: ap-northeast-2
        access_key: null
        secret_key: null
        insecure: false
  auth_enabled: false

  extraEnv:
    - name: AWS_ACCESS_KEY_ID
      valueFrom:
        secretKeyRef:
          name: s3-creds
          key: aws_access_key_id
    - name: AWS_SECRET_ACCESS_KEY
      valueFrom:
        secretKeyRef:
          name: s3-creds
          key: aws_secret_access_key
Helm repo 추가
helm repo add grafana https://grafana.github.io/helm-charts
helm repo update
Tempo 배포
kubectl create ns monitoring
helm upgrade --install tempo grafana/tempo -n monitoring --create-namespace   --values tempo-values.yaml
확인
kubectl -n monitoring get all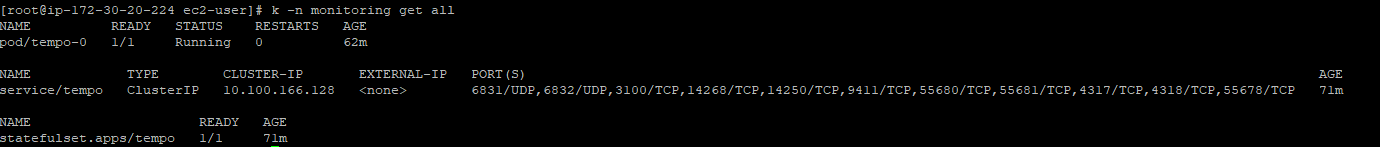
OpenTelemetry Collector
otel-agent-values.yaml 생성
podAnnotations:
  prometheus.io/scrape: "true"
  prometheus.io/port: "8887"

mode: daemonset

clusterRole:
  create: true
  rules:
    - apiGroups: [""]
      resources: [pods, namespaces, nodes, nodes/proxy, services, endpoints]
      verbs: [get, watch, list]
    - apiGroups: [extensions]
      resources: [ingresses]
      verbs: [get, list, watch]
    - nonResourceURLs: [/metrics]
      verbs: [get]

image:
  repository: otel/opentelemetry-collector-contrib
  tag: 0.99.0

config:
  receivers:
    otlp:
      protocols:
        grpc: {}
        http: {}

    filelog:
      include: [ /var/log/pods/*/*/*.log ]
      start_at: beginning
      include_file_path: true
      include_file_name: false
      retry_on_failure:
        enabled: true
      operators:
        - type: router
          id: get-format
          routes:
            - output: parser-containerd
              expr: 'body matches "^[^ Z]+Z"'
        - type: regex_parser
          id: parser-containerd
          regex: '^(?P<time>[^ ^Z]+Z) (?P<stream>stdout|stderr) (?P<logtag>[^ ]*) ?(?P<log>.*)$'
          output: extract_metadata_from_filepath
          timestamp:
            parse_from: attributes.time
            layout: '%Y-%m-%dT%H:%M:%S.%LZ'
        - type: regex_parser
          id: extract_metadata_from_filepath
          regex: '^.*\/(?P<namespace>[^_]+)_(?P<pod_name>[^_]+)_(?P<uid>[a-f0-9\-]{36})\/(?P<container_name>[^\._]+)\/(?P<restart_count>\d+)\.log$'
          parse_from: attributes["log.file.path"]
          cache:
            size: 128
        - type: move
          from: attributes.stream
          to: attributes["log.iostream"]
        - type: move
          from: attributes.container_name
          to: resource["k8s.container.name"]
        - type: move
          from: attributes.namespace
          to: resource["k8s.namespace.name"]
        - type: move
          from: attributes.pod_name
          to: resource["k8s.pod.name"]
        - type: move
          from: attributes.restart_count
          to: resource["k8s.container.restart_count"]
        - type: move
          from: attributes.uid
          to: resource["k8s.pod.uid"]
        - type: remove
          field: attributes.time
        - type: move
          from: attributes.log
          to: body

  processors:
    batch:
      timeout: 5s
      send_batch_size: 200

    attributes:
      actions:
        - action: insert
          key: loki.attribute.labels
          value: log.file.path, log.iostream, time, logtag
        - action: insert
          key: app
          value: k8s.container.name

    resource:
      attributes:
        - action: insert
          key: loki.resource.labels
          value: k8s.pod.name, k8s.node.name, k8s.namespace.name, k8s.container.name, k8s.container.restart_count, k8s.pod.uid

  exporters:
    loki:
      endpoint: http://loki-loki-distributed-gateway.logging/loki/api/v1/push
      tls:
        insecure: true

    otlp:
      endpoint: tempo.tempo.svc.cluster.local:4317
      tls:
        insecure: true

    prometheus:
      endpoint: "0.0.0.0:8889"

  extensions:
    memory_ballast:
      size_mib: 256

  service:
    telemetry:
      metrics:
        address: 0.0.0.0:8887
    extensions:
      - health_check
      - memory_ballast
    pipelines:
      logs:
        receivers: [filelog]
        processors: [batch, resource, attributes]
        exporters: [loki]

      traces:
        receivers: [otlp]
        processors: [batch]
        exporters: [otlp]

      metrics:
        receivers: [otlp]
        processors: [batch]
        exporters: [prometheus]

presets:
  logsCollection:
    enabled: true
    includeCollectorLogs: true

extraVolumes:
  - name: varlog
    hostPath:
      path: /var/log

extraVolumeMounts:
  - name: varlog
    mountPath: /var/log
기본적으로 pipeline은 service아래에 확인이 가능합니다.
log의 경우 filelog로 떨어뜨려서 otel collector이 수집하여 loki로 push합니다.
metric은 otel port를 open하여 prometheus가 가져갈 수 있게 구성합니다.
trace은
기본적으로 recievers에서 수집하고 processors에서 필요한 가공을하여 exporters에서 각각의 저장소로 push합니다.
현재 많은 설정을 두고 있어서 실습에는 모두 필요한 옵션은 아닙니다.
Helm repo 추가
helm repo add open-telemetry https://open-telemetry.github.io/opentelemetry-helm-charts
helm repo update
otel-agent 배포
helm upgrade --install otel-collector open-telemetry/opentelemetry-collector \
  -n monitoring \
  -f otel-agent-values.yaml
확인
kubectl -n monitoring get all

Grafana
저는 AWS ALB를 이용해서 접근하기 위해 사전에 Loadbalancer Controller을 배포하였습니다.
grafana-values.yaml 생성
adminPassword: "admin"

grafana.ini:
  server:
    root_url: "%(protocol)s://%(domain)s/grafana"
    serve_from_sub_path: true

service:
  type: ClusterIP

ingress:
  enabled: true
  annotations:
    kubernetes.io/ingress.class: alb
    alb.ingress.kubernetes.io/scheme: internet-facing
    alb.ingress.kubernetes.io/target-type: ip
    alb.ingress.kubernetes.io/backend-protocol: HTTP
    alb.ingress.kubernetes.io/healthcheck-path: /grafana/api/health
    alb.ingress.kubernetes.io/group.name: monitoring
  path: /grafana
  pathType: Prefix
  hosts: []

readinessProbe:
  httpGet:
    path: /api/health
    port: 3000
  initialDelaySeconds: 30
  periodSeconds: 10
  timeoutSeconds: 5
  failureThreshold: 10

livenessProbe:
  httpGet:
    path: /api/health
    port: 3000
  initialDelaySeconds: 60
  periodSeconds: 10
  timeoutSeconds: 5
  failureThreshold: 10
Helm repo 추가
helm repo add grafana https://grafana.github.io/helm-charts
helm repo update
Grafana 배포
helm install grafana grafana/grafana \
  -n monitoring \
  --create-namespace \
  -f grafana-values.yaml
확인
kubectl -n monitoring get all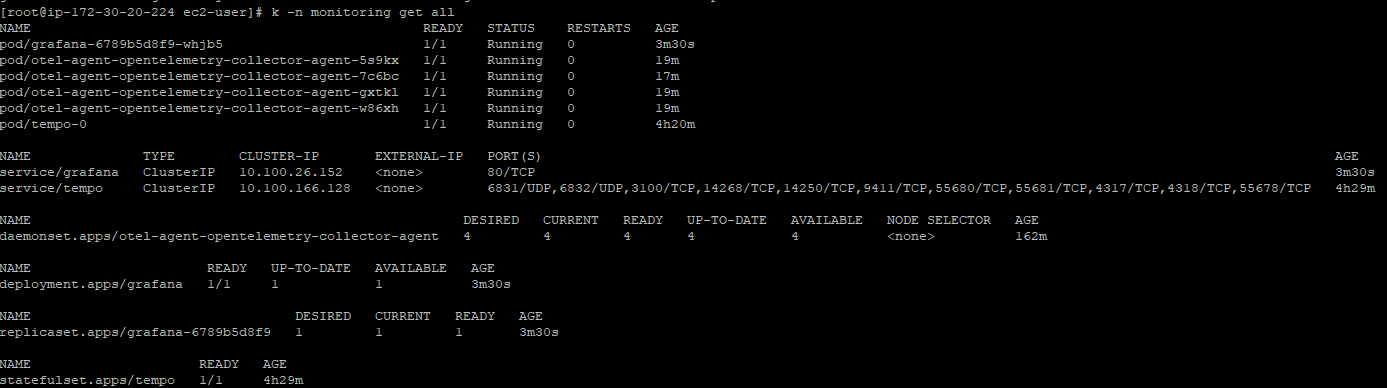

ALB ingress 구성
externalDNS등 ALB의 장점을 이용하여 호스트 헤더 기반으로 라우팅하면 좋지만
실습이므로 path 기반으로 구성하였습니다.
* 현재 grafana-values.yaml에서 선언하여 ALB가 구성되어있습니다. - group.name: monitoring
prometheus-ingress.yaml 생성
apiVersion: networking.k8s.io/v1
kind: Ingress
metadata:
  name: prometheus-ingress
  namespace: monitoring
  annotations:
    kubernetes.io/ingress.class: alb
    alb.ingress.kubernetes.io/scheme: internet-facing
    alb.ingress.kubernetes.io/target-type: ip
    alb.ingress.kubernetes.io/backend-protocol: HTTP
    alb.ingress.kubernetes.io/healthcheck-path: /prometheus/-/health
    alb.ingress.kubernetes.io/group.name: monitoring
spec:
  rules:
    - http:
        paths:
          - path: /
            pathType: Prefix
            backend:
              service:
                name: prometheus-server
                port:
                  number: 80
preometheus ingress 배포
kubectl apply -f prometheus-ingress.yaml
확인
kubectl -n monitoring get ingress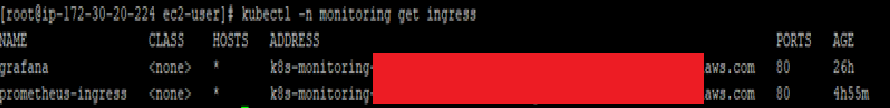
대시보드 구성
이렇게 모든 설치 과정을 끝냈습니다.
Metric, Trace, Logs가 잘 나오는지 확인합니다.
서비스들의 포트를 확인합니다.
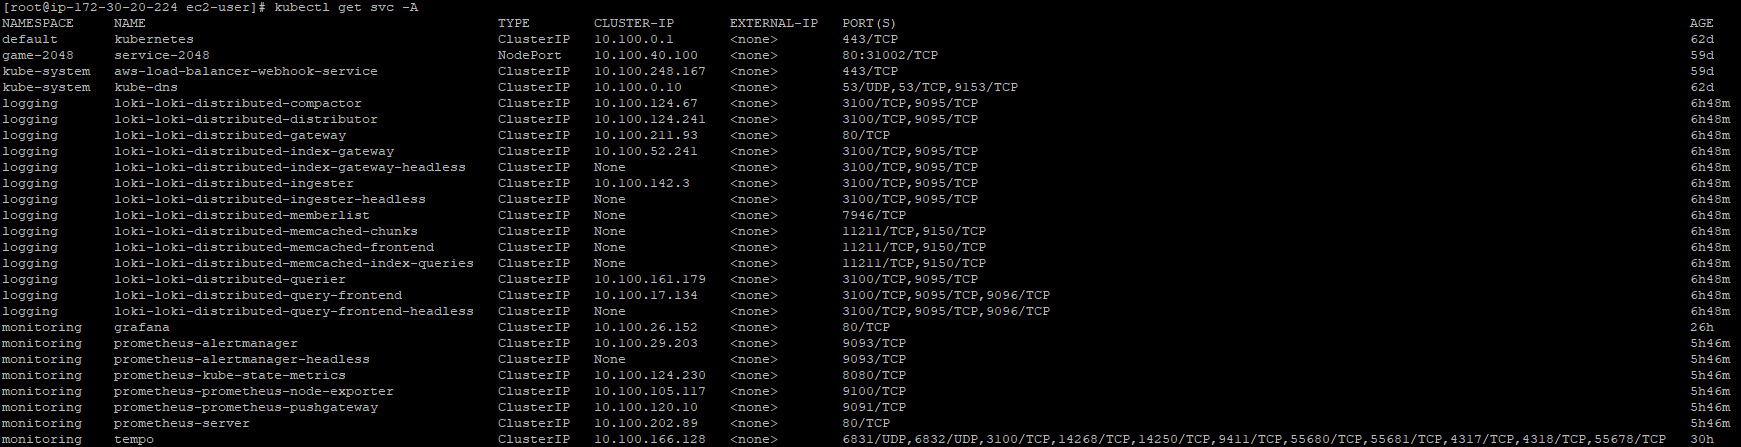
위의 구성파일을 그대로 이용하셨으면 포트 정보는 아래와 같습니다.
| Data Source | URL (Grafana 기준) | 포트 | 네임스페이스 |
| Prometheus | http://prometheus-server.monitoring:80 | 80 | prometheus |
| Loki | http://loki-loki-distributed-gateway.logging | 80 | loki |
| Tempo | http://tempo.monitoring:3100 | 3100 | monitoring |
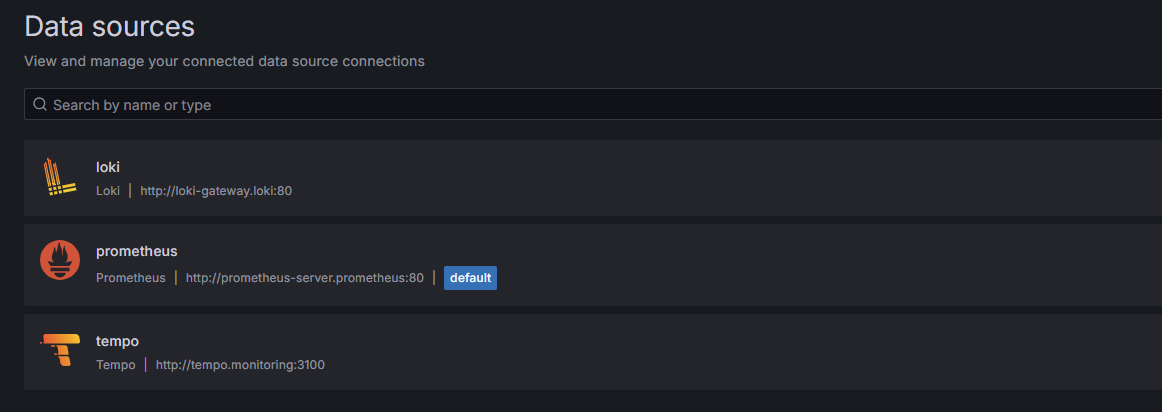
Grafana에서 Data Source들을 추가합니다.

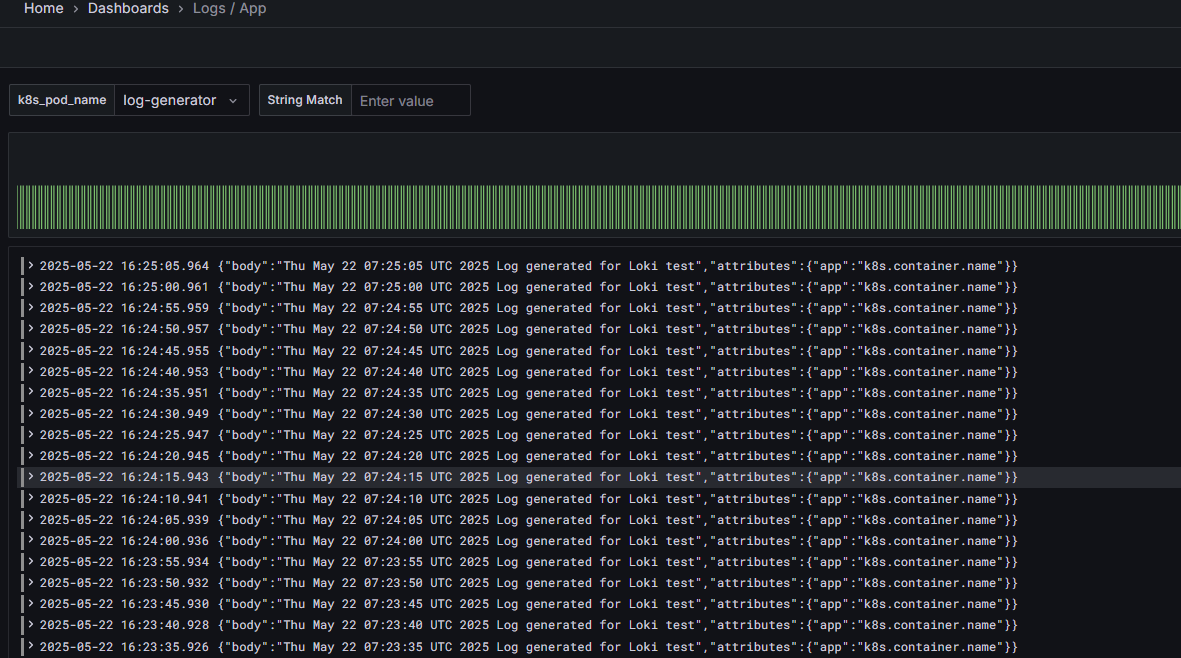
Loki 대시보드 확인
Dashboards -> import dashboard를 통해 확인합니다.
Import : 13639  (pod 단위 log)
Import : 12019 (Namespace 단위 log)
초기에 app으로 label을 받아오고 있습니다.
settings -> variables에서 변수를 변경해줍니다.
app -> k8s_pod_name

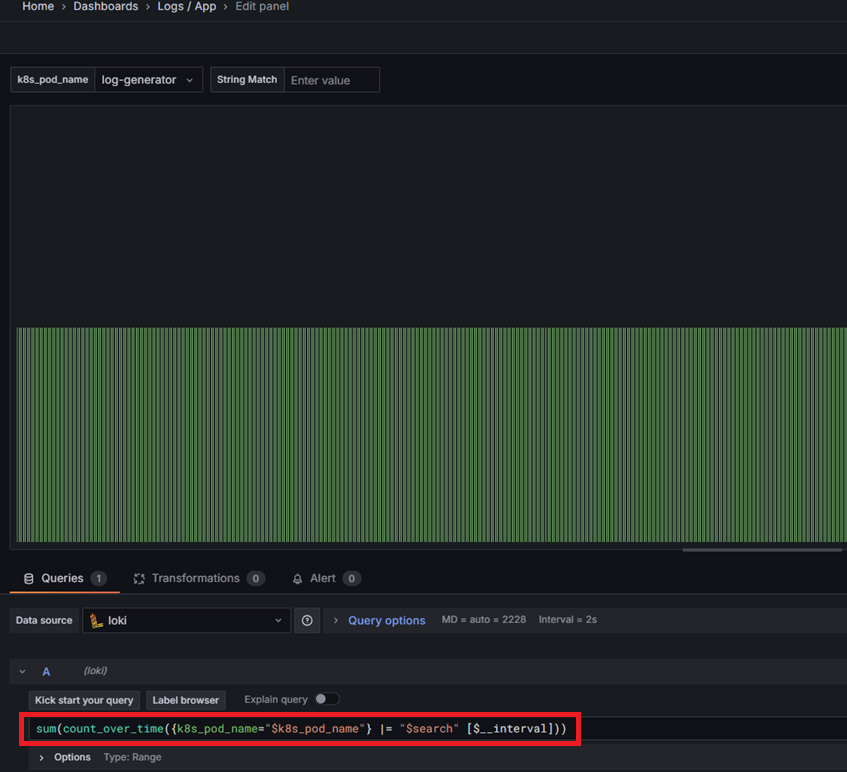
이후 패널들의 쿼리문도 변경합니다.
app="$app" --> k8s_pod_name="$k8s_pod_name"
밑에 대시보드도 변경 이후 적용합니다.
프로메테우스도 알맞은 대시보드를 구성하면 됩니다.

trace도 간단하게 Exploer에서 확인이 가능합니다.
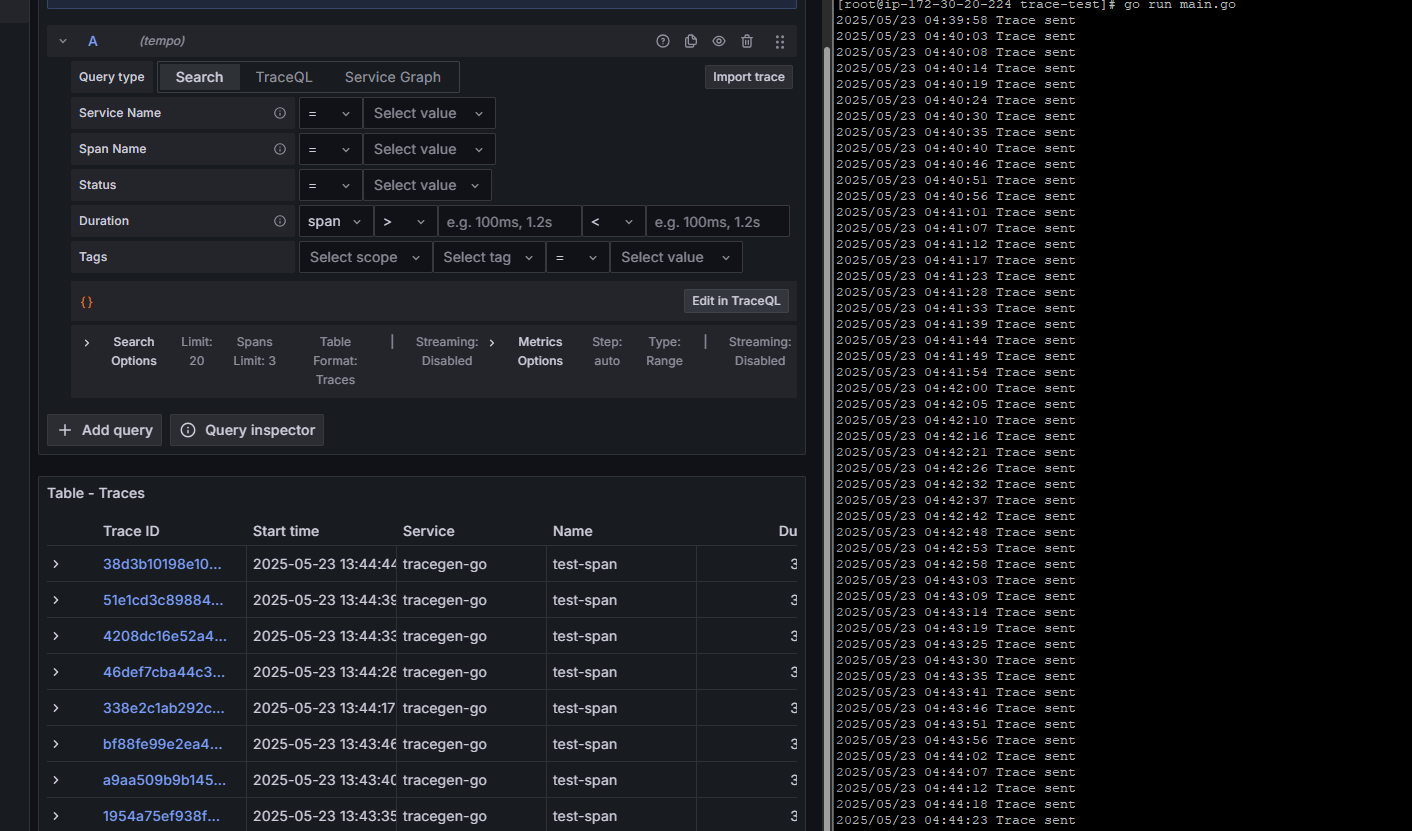

이렇게 OTEL Collector을 이용하여 수집기를 통일하고 Tempo, Loki, Prometheus로 저장하여 Grafana로 표출하는
옵저빌리티를 구축해보았습니다.
'쿠버네티스 > EKS' 카테고리의 다른 글
| EKS on Outposts - EBS CSI Driver 배포 (0) | 2025.05.20 |
|---|---|
| EKS on Outposts - Local Cluster 배포 및 ELB 확인 (0) | 2025.03.21 |

